
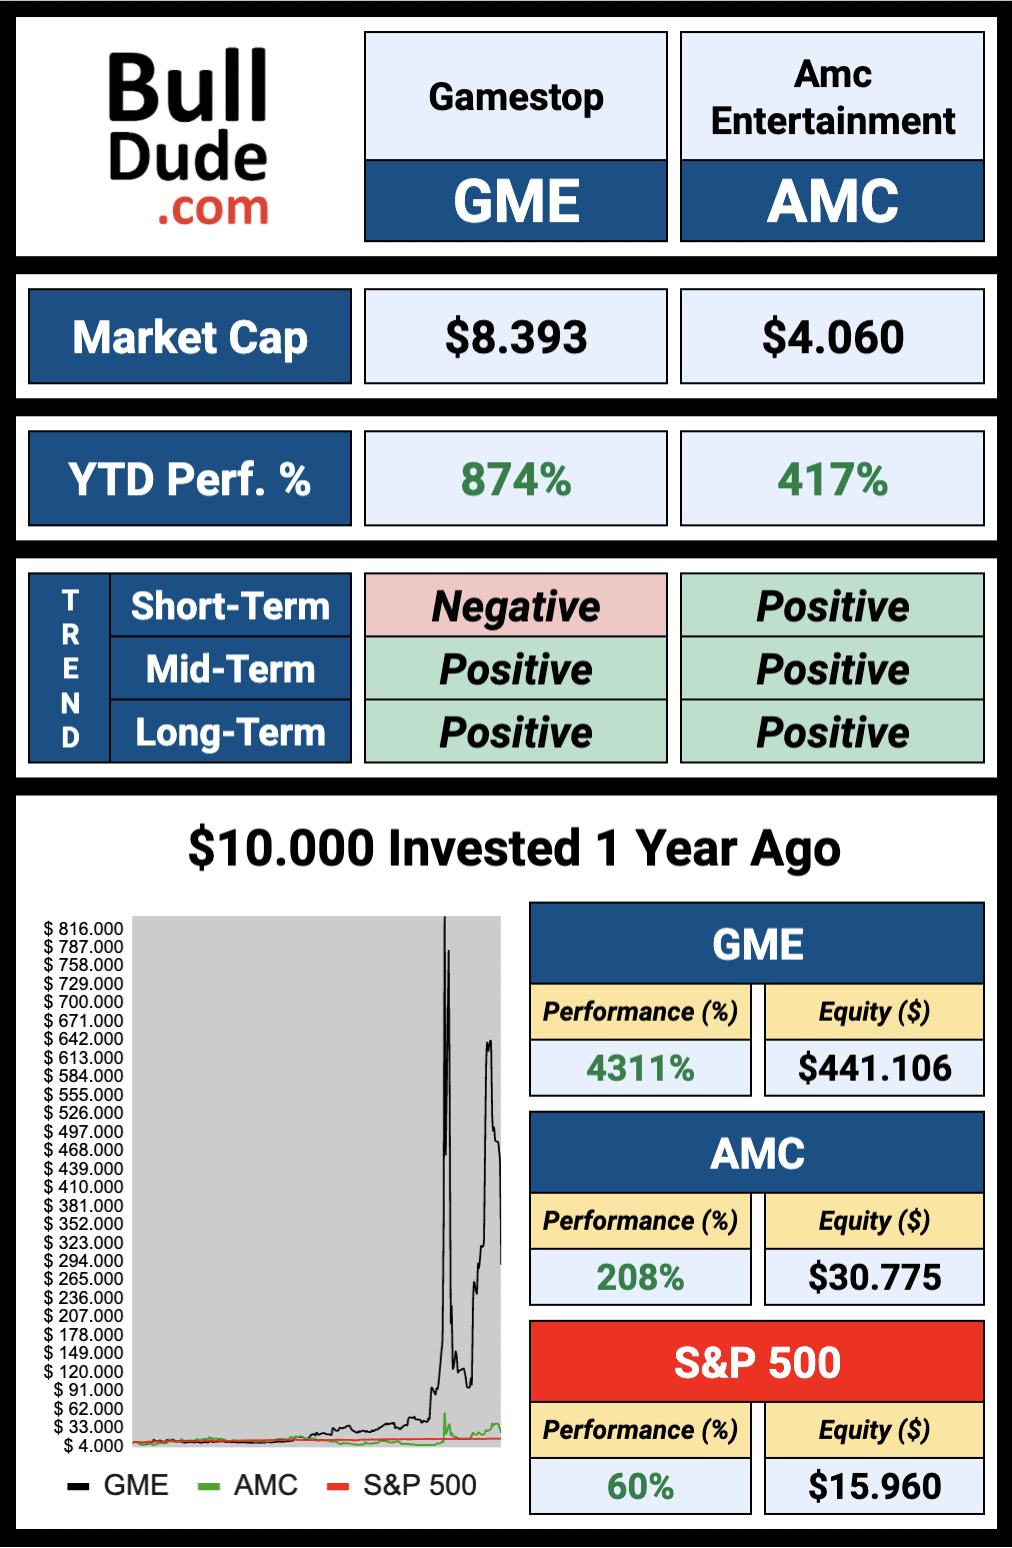
This type of analysis aims to inform readers about the main key data to know about stocks selected based on certain criteria. In this analysis we discover 2 of the most talked about companies in recent months and which have been at the center of the story that has seen Reddit vs the world of Hedge Funds. From Gamestop, where a $ 10,000 investment made in 1 year ago would have yielded more than $ 800,000, to AMC‘s multi-billion dollar losses.
Let’s find out more about these 2 companies.
The key data you need to know about the companies covered by this analysis are represented by a “BullDude’s Card”, which is a single image that contains key data that answers the following questions:
- Is the company’s business growing by increasing the main key business data (Revenue, EBITDA and Net Income)?
- Are the main business margins (EBITDA Margin and Net Margin) improving making the company more efficient?
- Will Revenue and Net Income grow in the coming months?
- Has the company’s value been growing more than the market index in recent months?
In addition, the key data are grouped within the SUMMARY in the following section, which is useful for showing them for all the companies covered by this analysis in order to facilitate comparison.
*click here for the description of the metrics in Italian.
Everything You Need to Improve Your Trading
From $ 3.80 per week
LEARN MORE
SUMMARY
Unlike the next section where you find an in-depth analysis on the individual companies covered by this analysis, in this section you will find the key data you need to know about all the companies in the same place, in order to make the comparison easier.
This summary is divided into 2 parts: Performance and Financials
PART 1 – Performance
The objective of this first part of the summary is to understand whether the companies covered here have grown in the last 12 months and since the beginning of the year (YTD, Year-To-Date). In addition, you will find information on the trend of the stock price in the short, medium and long term. In conclusion, you will find a section that shows the performance of a $ 10,000 simulated investment made 12 months ago in each company against the market index chosen as the benchmark.
PART 2 – Financials
The objective of this second part of the summary is to focus attention on the key business data of the companies in recent years and on expectations of future growth. In particular, the focus is on: the ability to increase the size of the business (by increasing Revenue); ability to produce continuously improving operating income (increasing EBITDA); ability to produce a net profit at the end of the year after all costs incurred (positive and growing Net Income).
Furthermore, the focus is on the ability of companies to improve business efficiency, increasing the main business margins, especially what concerns the operational part that is not affected by financial and fiscal costs (positive and growing EBITDA margin).
For an in-depth analysis on the financials of the last 5 years of all the companies covered here, in the next section, you will find intuitive graphs that show the trend year after year.
*Data in Millions of USD
Would You Like an Analysis on Your Favorite Stocks?
From $ 3.98 / stocks
LEARN MORE
IN-DEPTH ANALYSIS
Below you will find an insight into individual companies using BullDude’s Cards, which is a single image that contains all the most important key data you need to know. The metrics that you find in the image are the same as those present in the 2 previous sections (Performance and Financials) but, especially with regard to financials, in this section you will also find graphs showing the trend year after year.
Gamestop (GME)
GameStop Corp. is the world’s largest video game and entertainment software retailer. The company operates 4,816 retail stores across the United States and in fifteen countries worldwide. The company also operates two e-commerce sites, GameStop.com and EBgames.com, and publishes Game Informer’ magazine, a leading multi-platform video game publication. GameStop Corp. sells new and used video game software, hardware and accessories for next generation video game systems from Sony, Nintendo, and Microsoft. In addition, the company sells PC entertainment software, related accessories and other merchandise.
*Data in Millions of USD

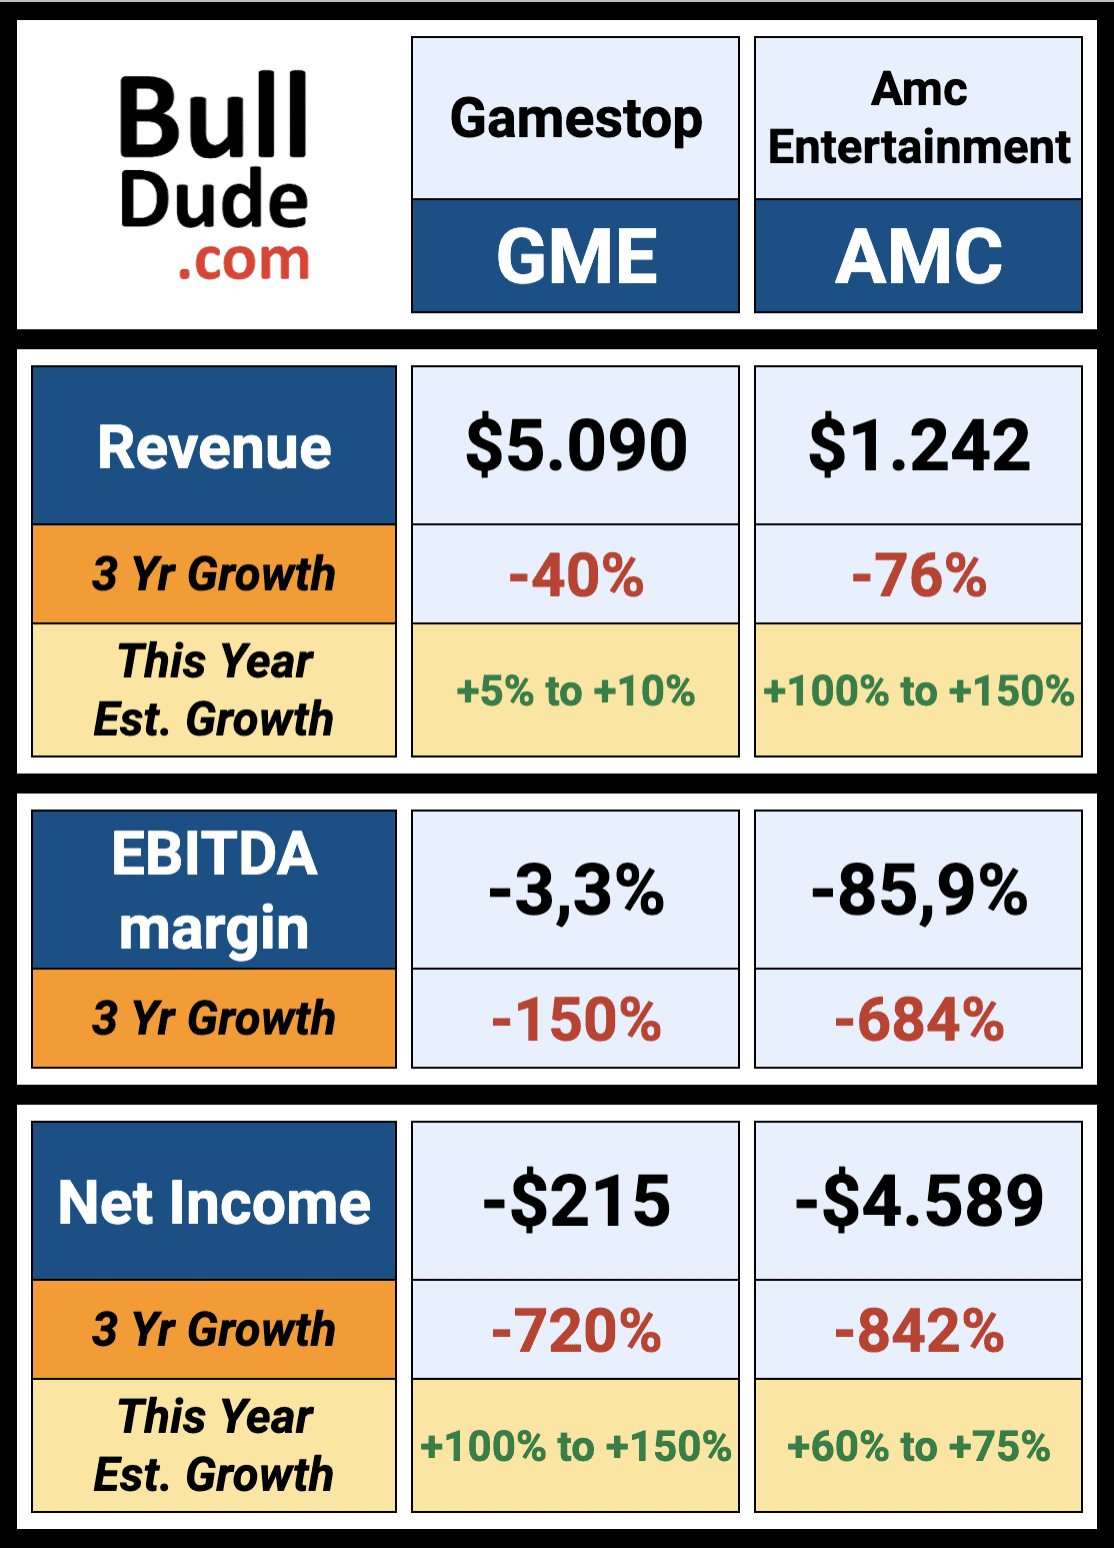
In the last 3 years, Gamestop revenue have decreased from $8.547 million to $5.090 million ( -40% ) and analysts expect growth in the coming months (ranging +5% to +10% ).
The main business margin (EBITDA margin) worsened by -150% in the same period, a sign that Gamestop is worsening the efficiency of the business. In the past 12 months, Gamestop has produced a net loss of -$215 million (down -720% over the past 3 years) and analysts expect growth in the coming months (ranging +100% to +150% ).
Amc Entertainment (AMC)
AMC Entertainment Holdings, Inc., operates as a theatrical exhibition company primarily in the United States and internationally. It owned or interests in theatres and screens.
*Data in Millions of USD

In the last 3 years, Amc Entertainment revenue have decreased from $5.079 million to $1.242 million ( -76% ) and analysts expect growth in the coming months (ranging +100% to +150% ).
The main business margin (EBITDA margin) worsened by -684% in the same period, a sign that Amc Entertainment is worsening the efficiency of the business. In the past 12 months, Amc Entertainment has produced a net loss of -$4.589 million (down -842% over the past 3 years) and analysts expect growth in the coming months (ranging +60% to +75% ).
Would You Like an Analysis on Your Favorite Stocks?
From $ 3.98 / stocks
LEARN MORE
Sources & additional info
*all data is current as of the day this article was written
*company description by barchart.com
*growth estimates revised from the data on ziggma.com
Do you need help? contact us:
The information in this article is for informational purposes only and does not constitute investment advice. For the full disclaimer click here.
