
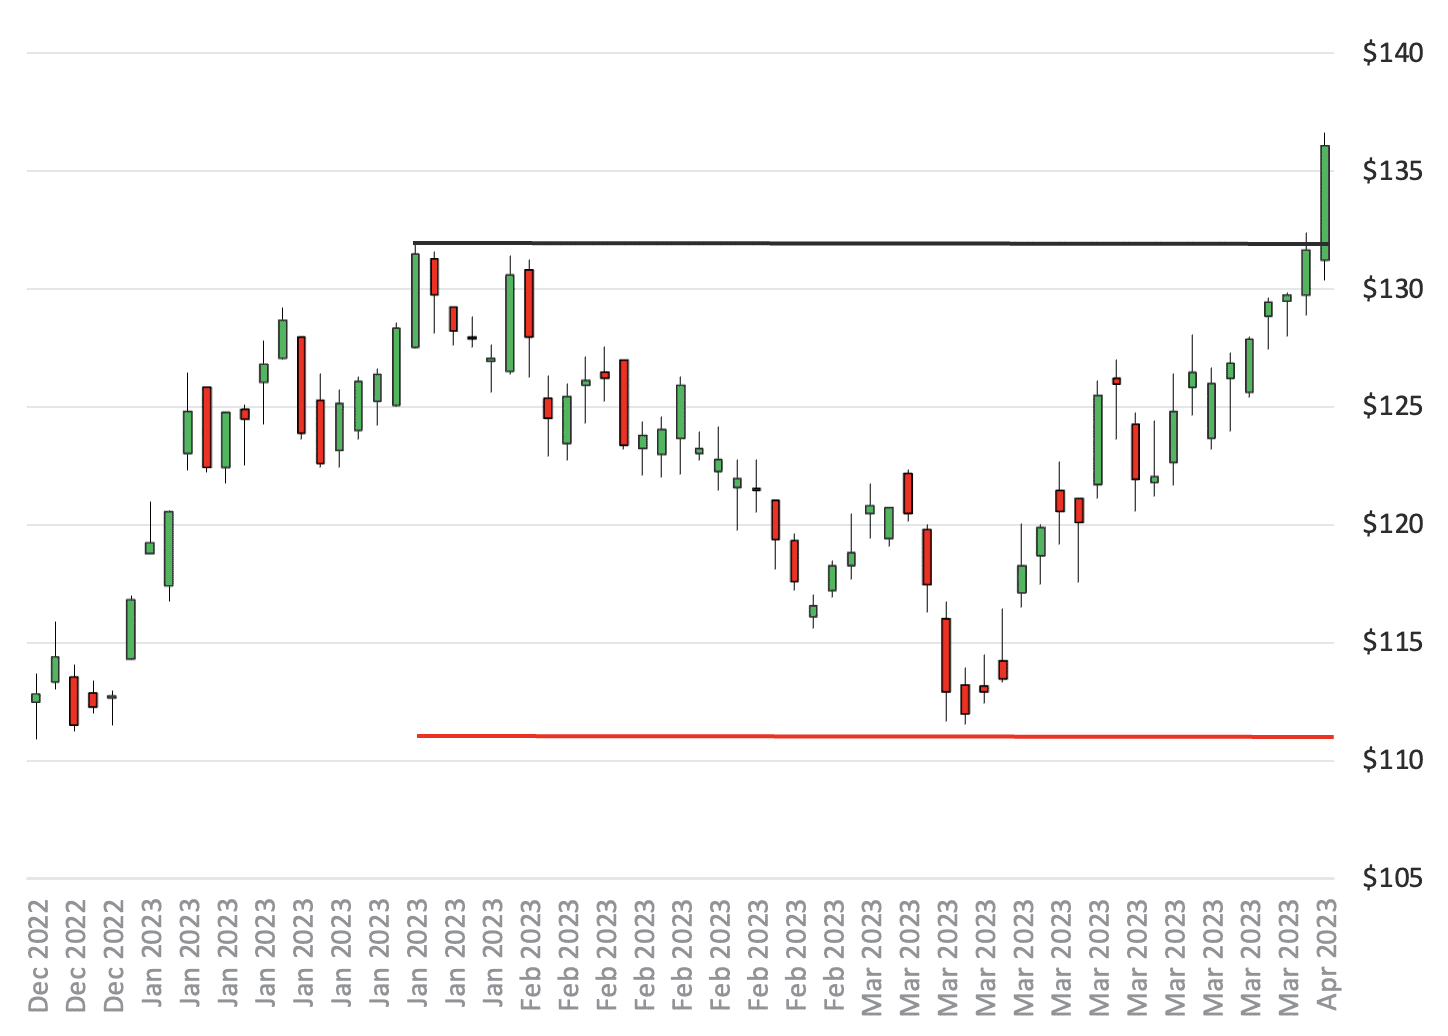
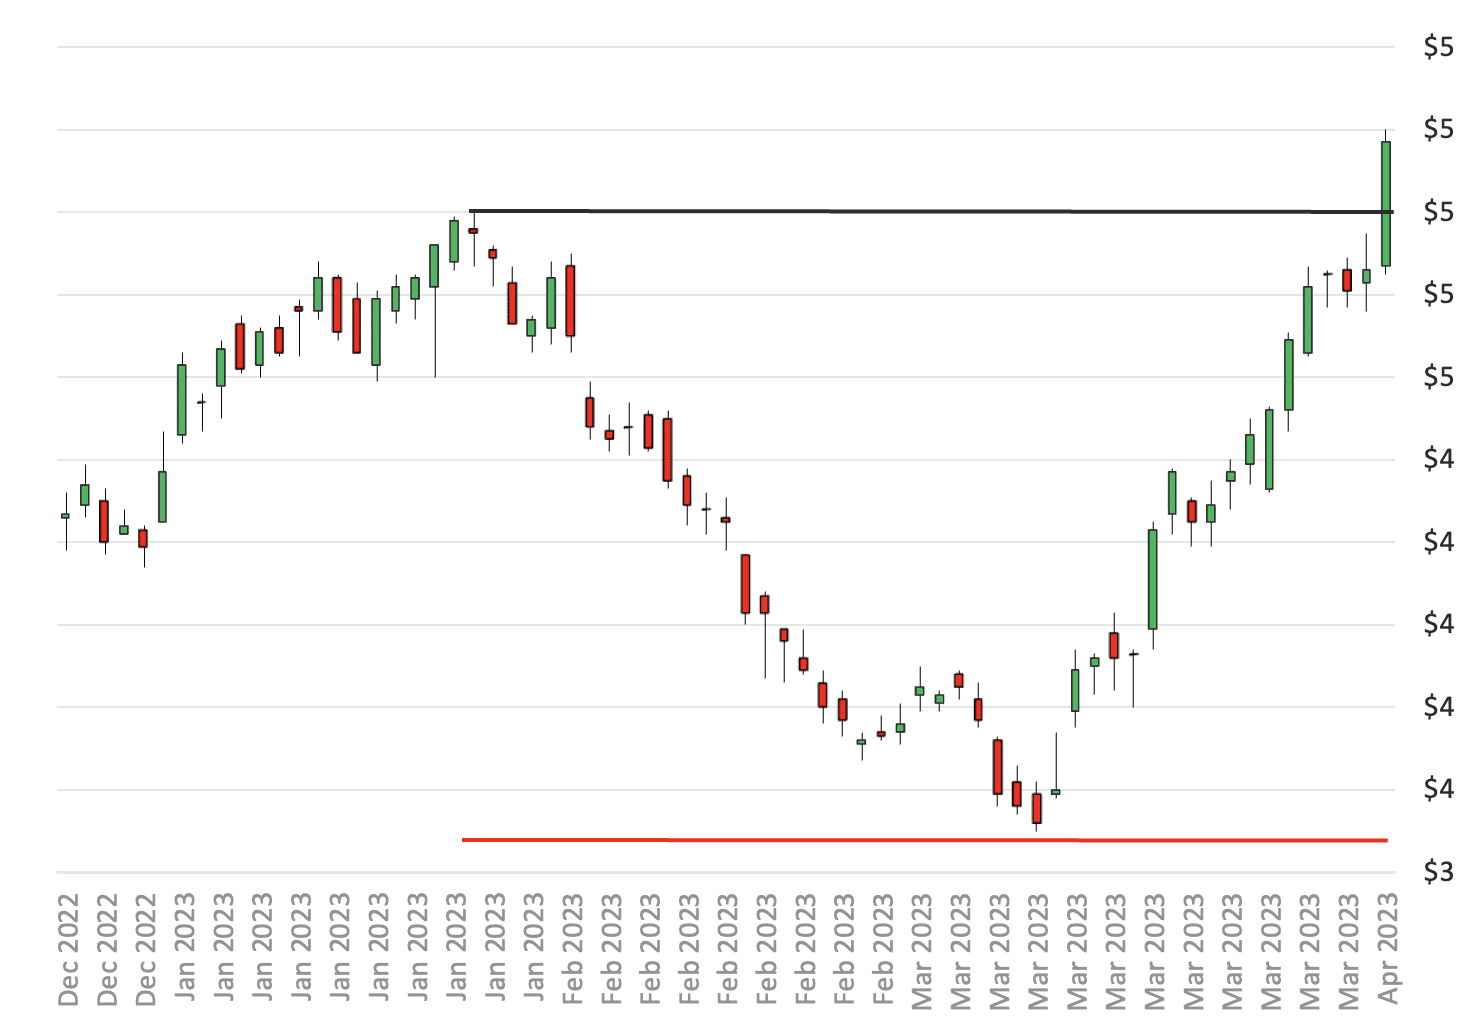
Inside this article you can find the companies that today showed the Resistance Breakout Chart Patterns. In addition, the companies shown here have a particular chart conformation that increases the probability of the positive trend continuing.
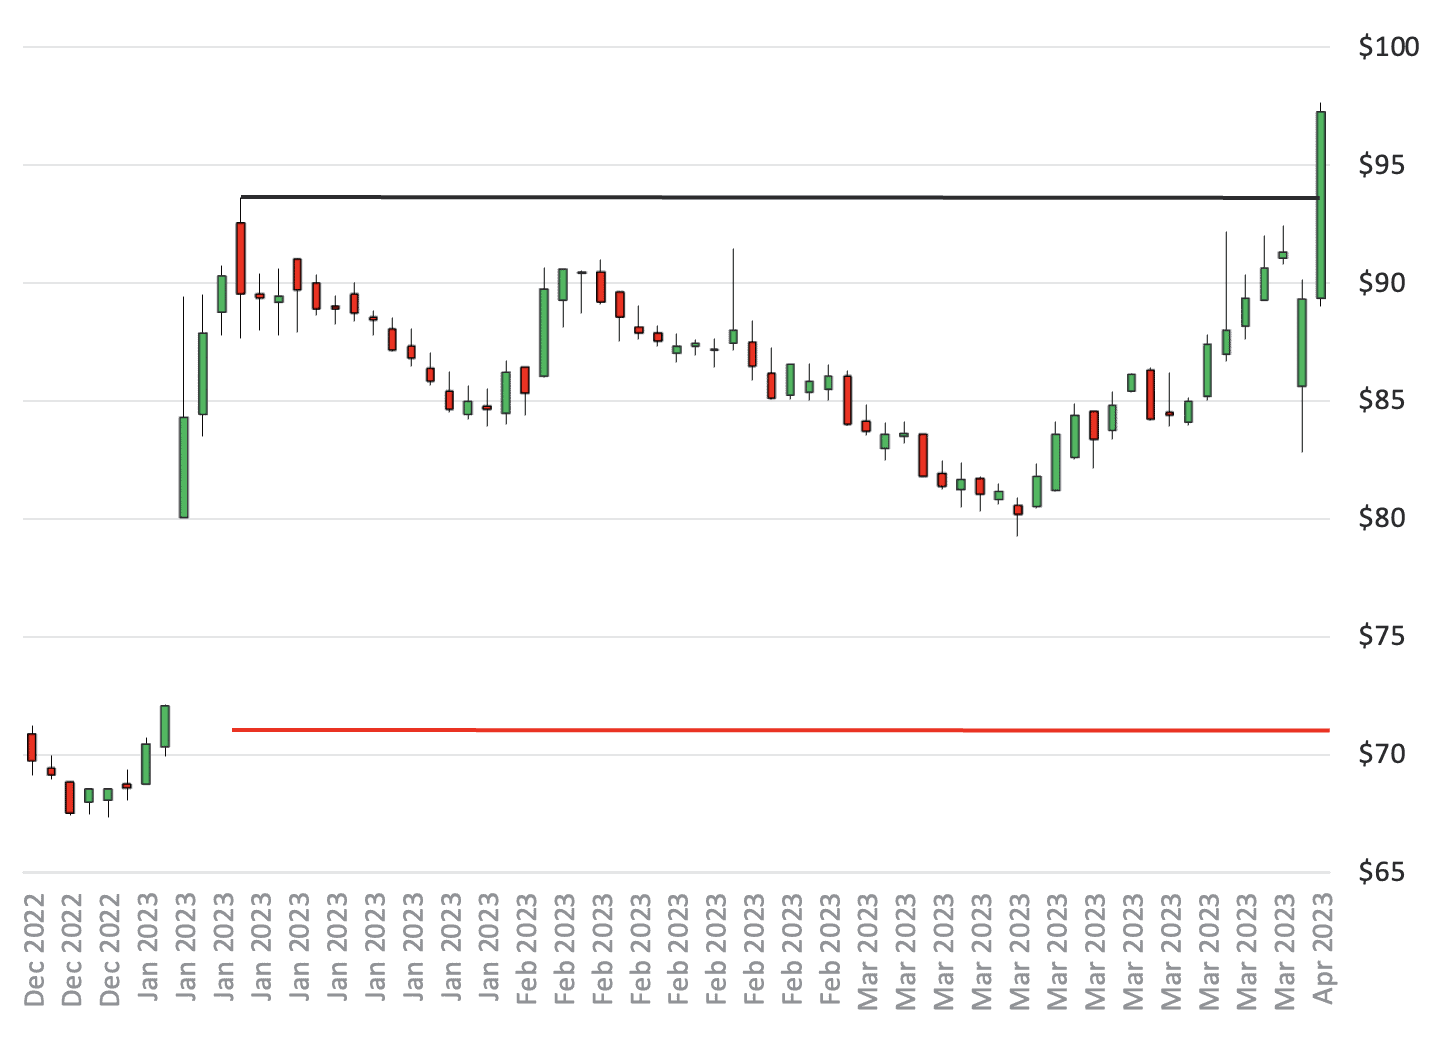
Resistance is a price level within a positive trend in the stock price that stops growth and does not allow for continuation, so it is an obstacle. In order for the stock price to continue growth it must overcome this obstacle, i.e. reach a price level above the resistance. So knowing which companies have just overcome this hurdle and are ready to continue growth is very useful information.

Precisely for this reason within the BullDude.com Membership you will find many articles published constantly called “Resistance Breakout” containing the best companies that have just overcome this obstacle.
How do I know if it’s a false breakout?
The breakout is defined as “false” when the positive trend that supported the price growth reverses the direction (going from positive to negative). To understand when this event occurs, there is a red half-line in the chart that indicates the level below which the positive trend can be considered concluded.
A few negative days are not enough to call it a “false” breakout because often the cause is natural temporary volatility (given by the retest of the signal level or profit taking or general market crash).
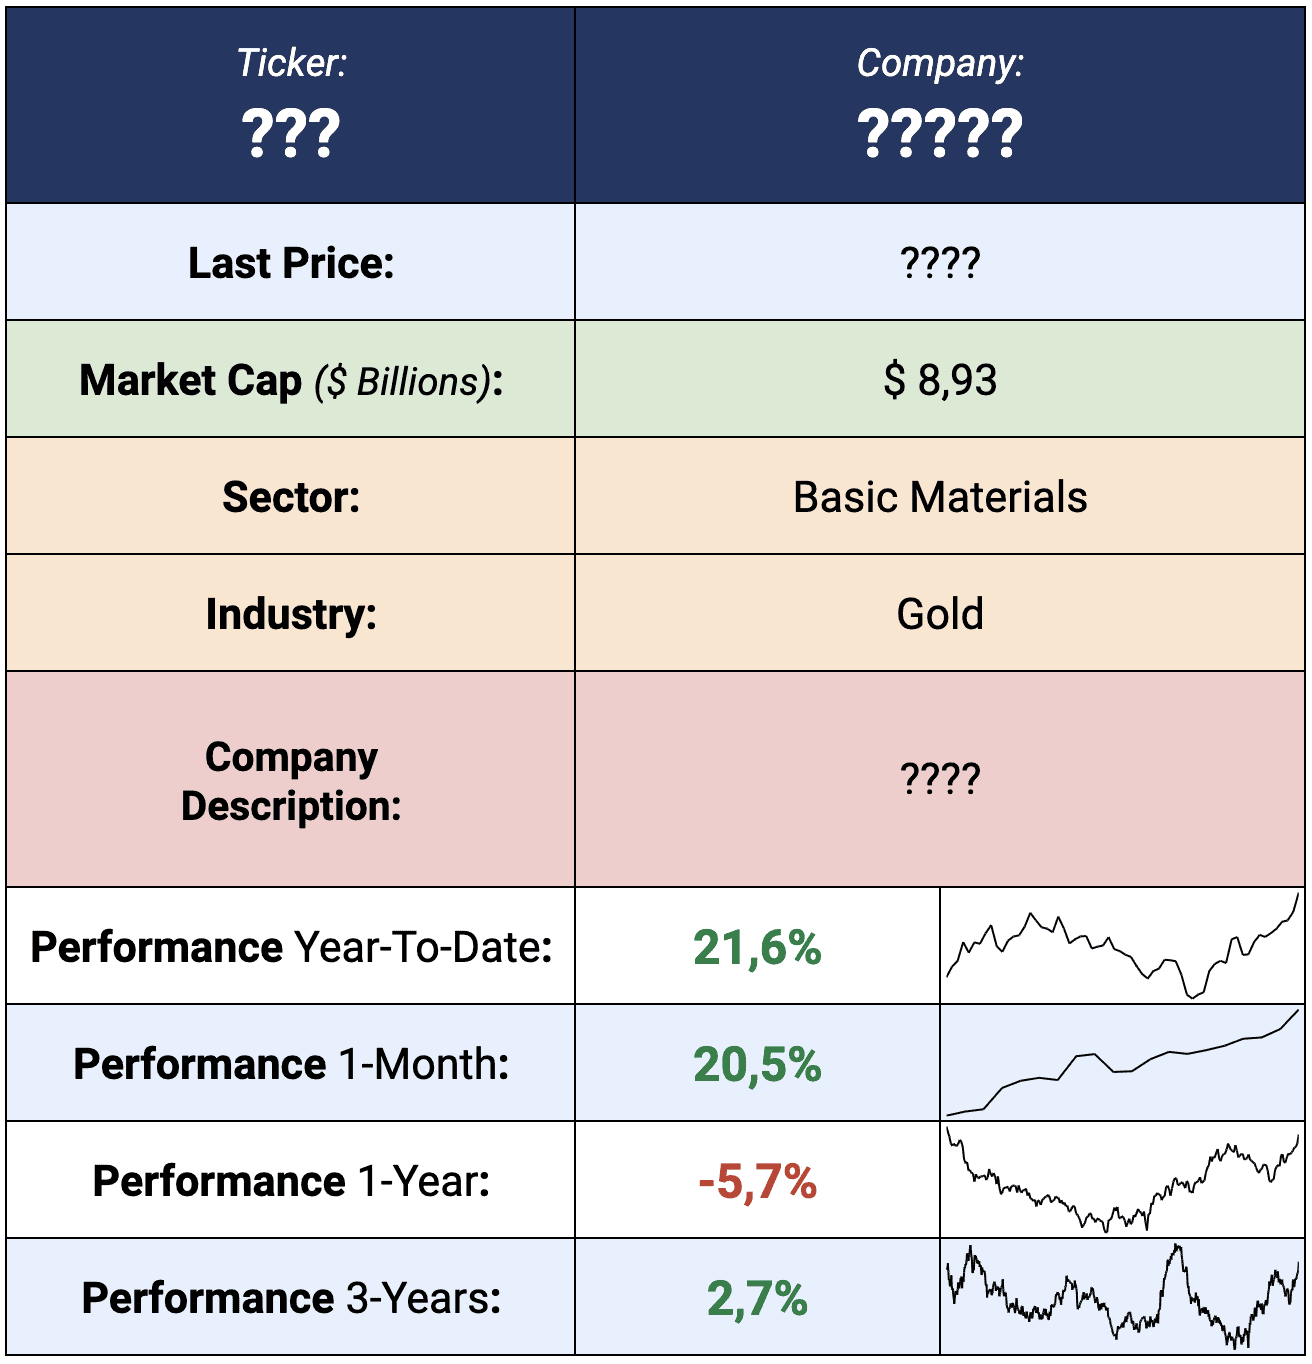
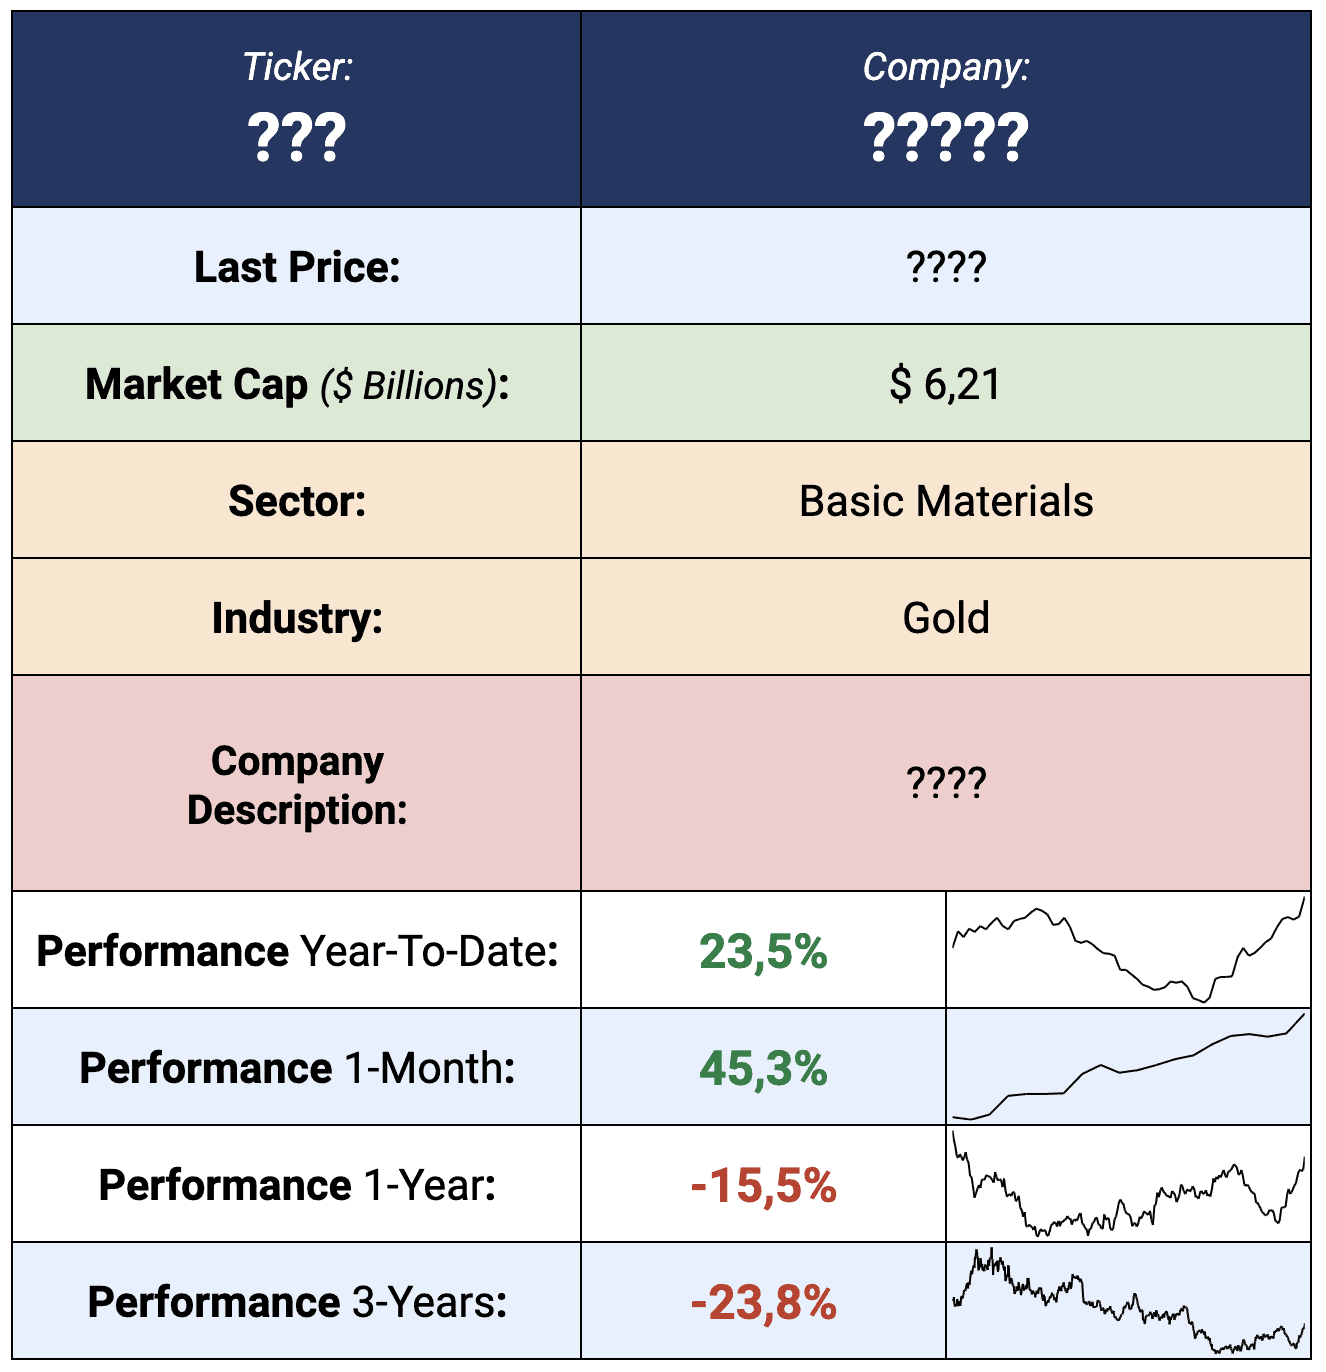
Today’s Resistance Breakout
Company 1:
Are you a member? Login
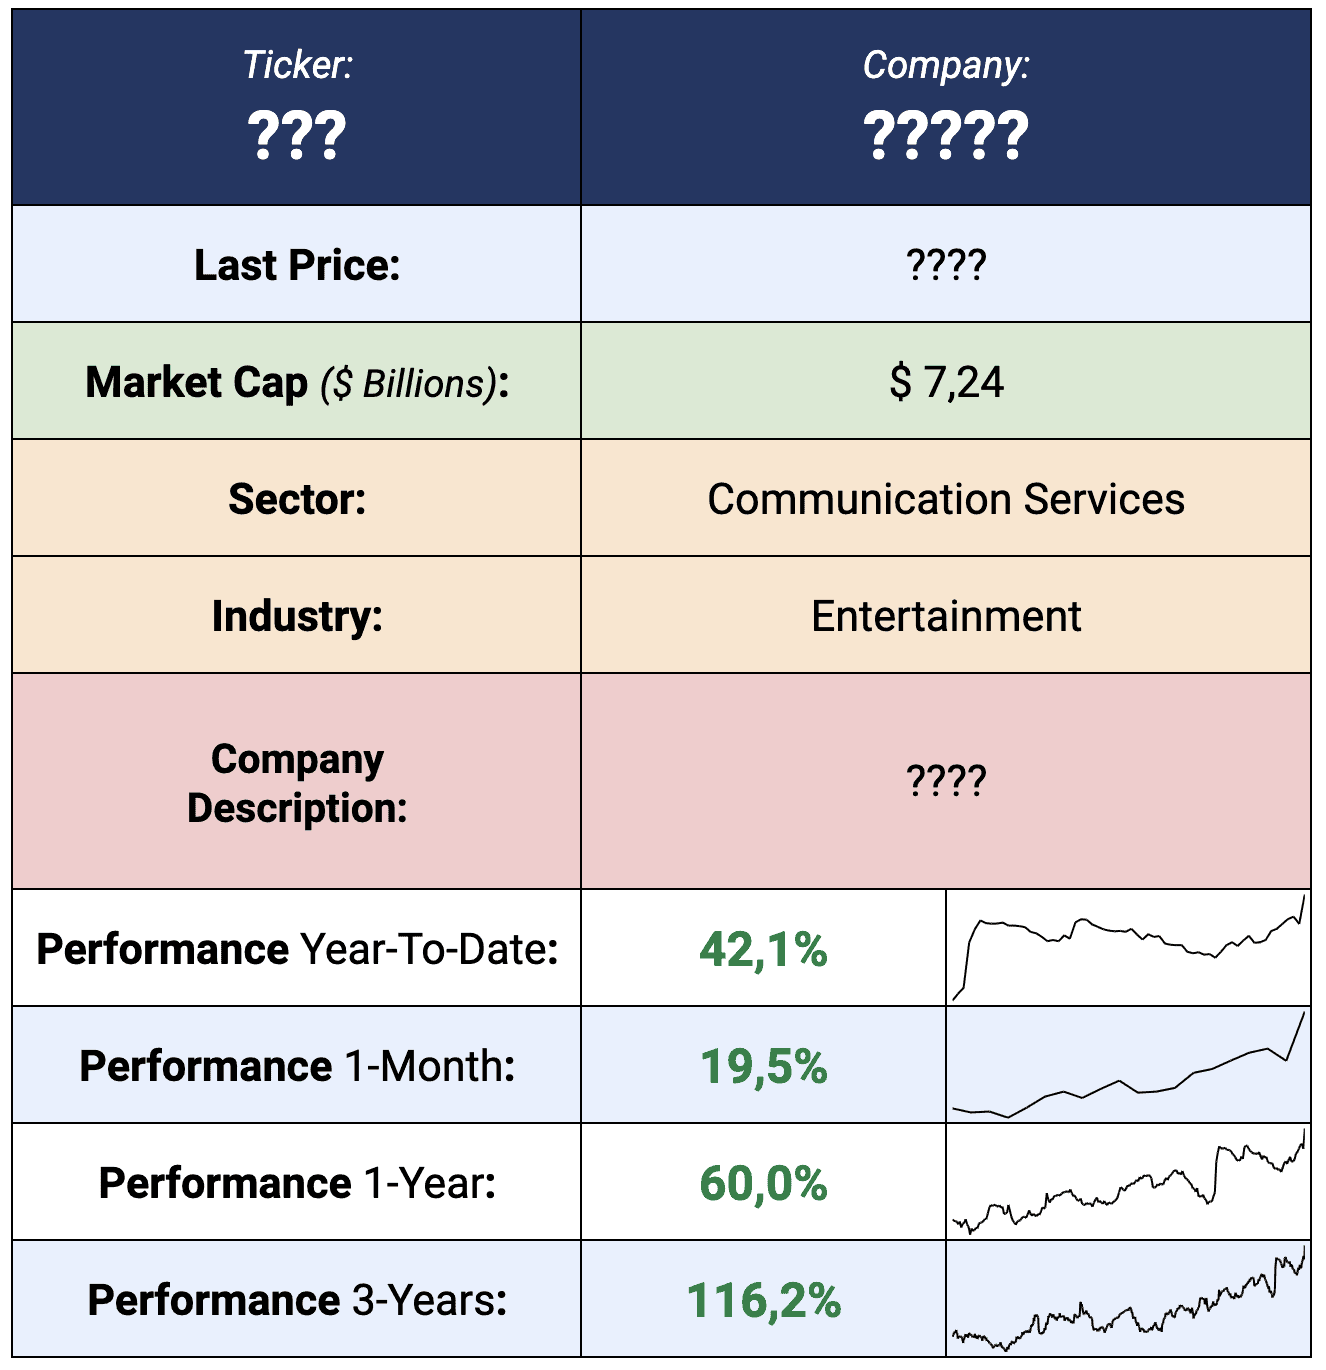
Company 2:
Company 3:
Exclusive Content
for Members
Are you a member? Login
If you are NOT a member keep reading!
EVERYTHING
YOU NEED
FOR YOUR TRADING
Meet your all-in-one membership.
SCREENER
Find out every day which Stocks and Crypto show the best chart patterns and trading signals.
BACKTEST
Find out which stocks have shown the best results after a certain chart pattern or trading signal has appeared.
CHART PATTERNS
Discover the stocks showing the resistance, trendline and potential breakout chart patterns
TREND ANALYSIS
Discover the direction and strength of the trend of the 150 best stocks and the 50 best crypto.
STOCK ANALYSIS
Discover the most interesting stocks based on the key business data such as revenue and net income.
EARNINGS REPORTS
Discover the analysis on the most anticipated stocks that are about to release the earnings reports.
WHAT WE OFFER
Satisfied or Refunded
Not satisfied? No problem. Just let us know within 14 days and you will get a full refund without having to give us an explanation.
Secure Payments
Choose from the 2 world leaders in digital payments that guarantee 100% security. PayPal and Stripe.
Up to 16% off
Take advantage of the 16% discount on 1-Year Membership, equivalent to a cost of $ 3.80 per week while saving $40 in 1 year.
What are you waiting for?
Access hundreds of exclusive content with the BullDude.com Membership
You May Also Like…


To discover the other Chart Patterns published on BullDude.com
Don’t want to miss BullDude.com exclusive content?
Join the Telegram Channel for free
Do you need help? contact us:
Mail: bulldude.info@gmail.com
Everything You Need For Your Trading
In BullDude.com Membership you will find exclusive content in one place:
👉 Screener and Backtest
👉 Chart Patterns
👉 Trend Analysis
👉 Key Business Data
👉 Earnings Reports
Data provided by Financial Modeling Prep
The content of this article is for informational purposes only and in no case constitute an investment advice. To read the complete disclaimer click here.
