
The purpose of the trend analysis is to provide key information on the direction, strength and timing of change in the stock price trend in the short, medium and long term. This analysis covers the Top 150 Stocks on the United States stock exchange that are grouped in the BullDude’s Bundles.
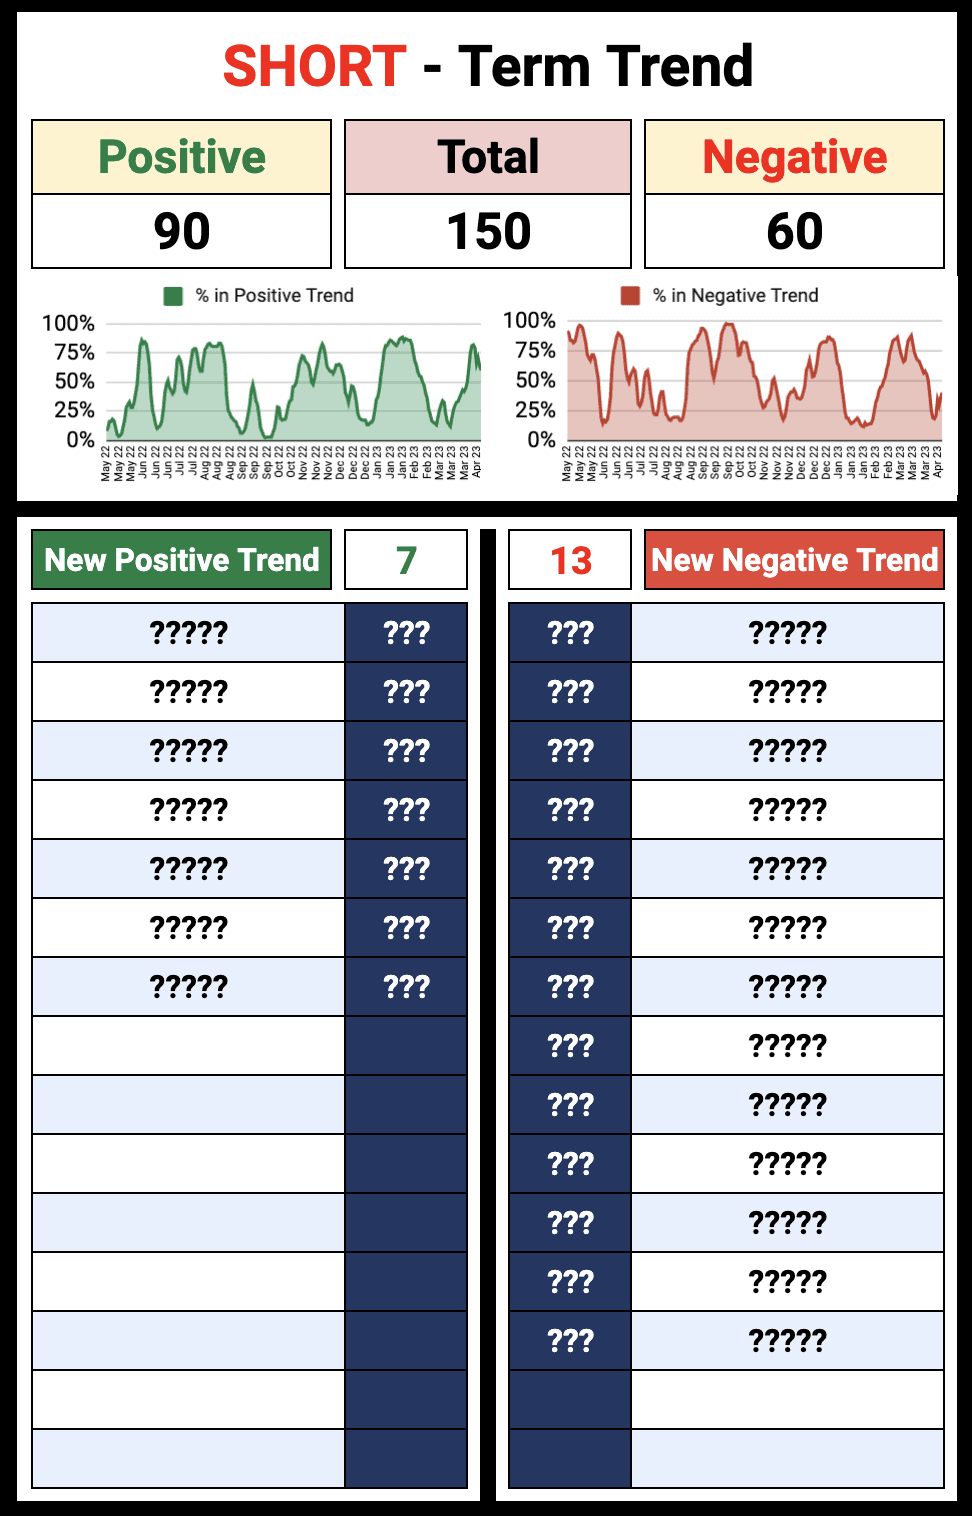
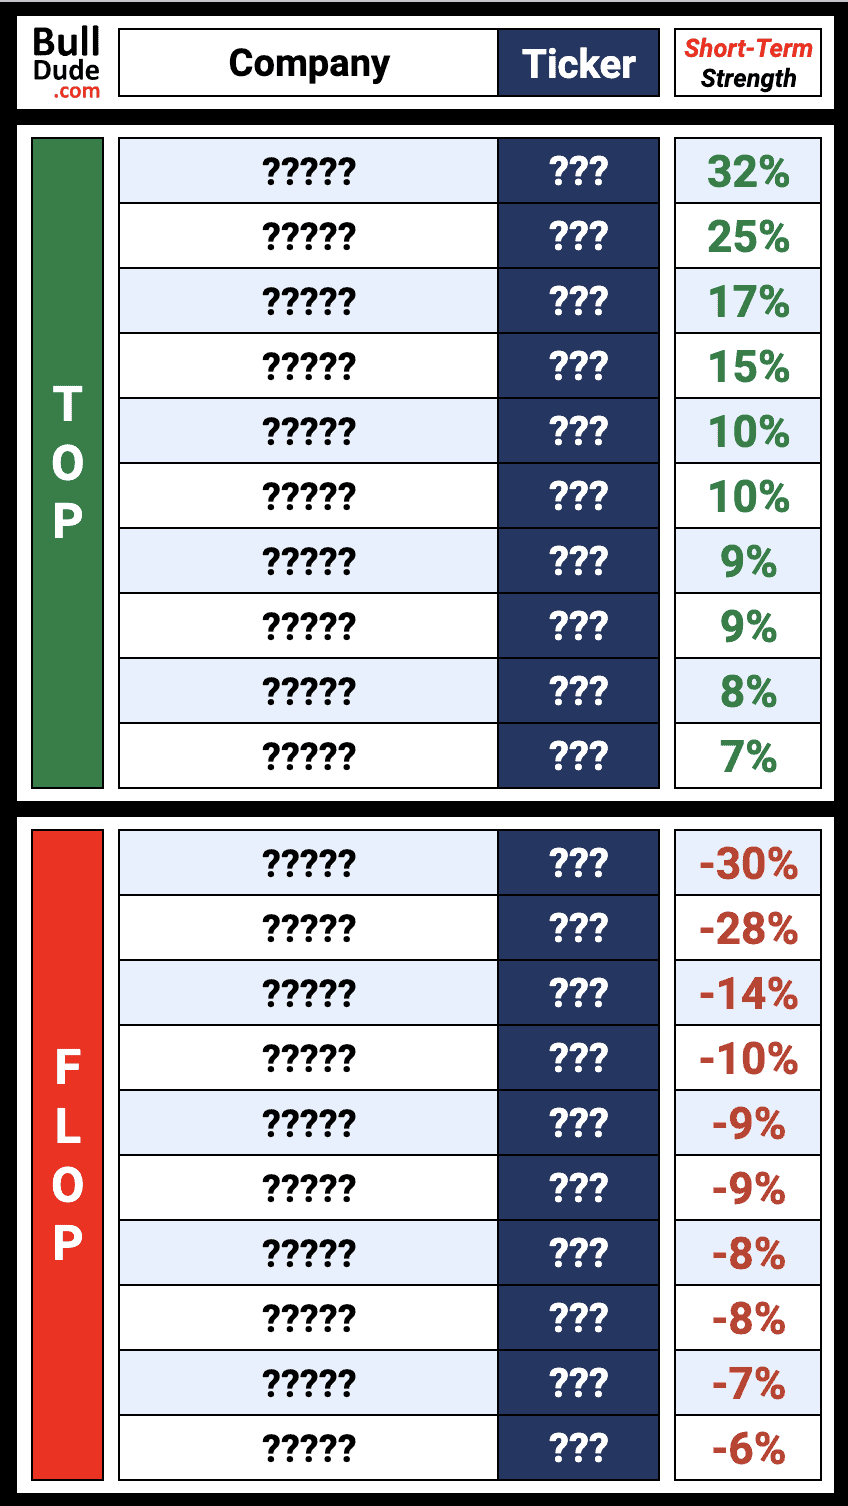
Below you can find a brief explanation of the 2 key terms to help you understand how the direction and strength of the stock price trend is calculated using one of the most reliable tools: Moving Average. This article includes a lot of key data and information on each of the top 150 Stocks covered. Given the enormous amount of data and information, the following 2 sections have been introduced that allow you to access the data through summaries and rankings. This first section shows which stocks have just changed the direction of the trend and intuitive rankings that allow you to find out which stocks have the strongest positive / negative trend for each of the 3 time periods considered (short, medium and long term). Furthermore, a ranking is also shown for the so-called “All-Term” period, where only the stocks that have a positive (or negative) trend in both the short, medium and long term are included. In summary, this section answers the following questions: This second section shows, for each of the top 150 stocks, the direction and strength of the trend for each time period; short, medium and long term. The purpose of this section is to answer the following questions: This section shows summaries and rankings that allow you to understand which stocks have reversed the trend and which show the strongest positive and negative trends. Below you will find the 4 individual sections that contain the summaries and rankings for each of the 4 time periods previously mentioned; Short-Term, Mid-Term, Long-Term and All-Term Trend. In this section we focus on stocks by looking at short-term trend data only which is identified using the 20-day moving average: Do you need a more detailed explanation? click here This subsection shows the total number of stocks covered by the analysis (Total), the number of stocks that currently have a positive / negative trend (Positive / Negative) and the stocks that have seen, at the end of today’s trading session, a reversal of the short-term trend from negative to positive (New Positive Trend) and from positive to negative (New Negative Trend). In addition, there are 2 graphs that show the trend of the last few weeks of the percentage of stocks in positive and negative trend. It is important to remember that as soon as a company reverses the trend it will initially be weak and it will take a few days of confirmation to be trusted. Furthermore, it is preferable to also look at the direction and strength of the trend in the other time periods. For example, if company X enters a short term positive trend but is in a strong medium and long term negative trend it could be a risky situation. Are you a member? Login This subsection shows the 10 stocks with the strongest positive short-term trend (TOP) and the 10 stocks with the strongest negative short-term trend (FLOP). For each company included in the ranking there is a percentage value that indicates the direction of the trend (positive trend if colored green or negative if colored red) and an indication of the strength of the trend (the higher the percentage, the stronger the trend). Do you need a more detailed explanation? click here In this second section we find the data on the direction and strength of the short, medium and long term trend for each of the 150 top stocks that are covered by this analysis. As additional information there is also the item “Distance to 52-Wk High”, useful for understanding how much the company’s price must increase to return to the maximum price reached in the last 52 weeks starting from the average price of the last 2 days. For each company included there is a percentage value that indicates the direction of the trend (positive trend if colored green or negative if colored red) and an indication of the strength of the trend (the higher the percentage, the stronger the trend). Do you need a more detailed explanation? click here Exclusive Content Are you a member? Login If you are NOT a member keep reading! Meet your all-in-one membership. SCREENER BACKTEST CHART PATTERNS TREND ANALYSIS STOCK ANALYSIS EARNINGS REPORTS WHAT WE OFFER Access hundreds of exclusive content with the BullDude.com Membership In BullDude.com Membership you will find exclusive content in one place: Data provided by Financial Modeling Prep
Key Terms
Summaries and Rankings
1. Trend Rankings
2. Trend of the Top 150 Stocks
1. Trend Rankings
1.1 Short-Term Trend
2-day moving average Higher (Lower) than 20-day moving average
2-day moving average Crossed above (below) the 20-day moving averageSummary
Rankings
Mid, Long and All-Term Trend Sections
2. Trend of the Top 150 Stocks

for Members
EVERYTHING
YOU NEED
FOR YOUR TRADING
Find out every day which Stocks and Crypto show the best chart patterns and trading signals.
Find out which stocks have shown the best results after a certain chart pattern or trading signal has appeared.
Discover the stocks showing the resistance, trendline and potential breakout chart patterns
Discover the direction and strength of the trend of the 150 best stocks and the 50 best crypto.
Discover the most interesting stocks based on the key business data such as revenue and net income.
Discover the analysis on the most anticipated stocks that are about to release the earnings reports.
Satisfied or Refunded
Not satisfied? No problem. Just let us know within 14 days and you will get a full refund without having to give us an explanation.
Secure Payments
Choose from the 2 world leaders in digital payments that guarantee 100% security. PayPal and Stripe.
Up to 16% off
Take advantage of the 16% discount on 1-Year Membership, equivalent to a cost of $ 3.80 per week while saving $40 in 1 year.What are you waiting for?
Everything You Need For Your Trading
👉 Screener and Backtest
👉 Chart Patterns
👉 Trend Analysis
👉 Key Business Data
👉 Earnings Reports
The content of this article is for informational purposes only and in no case constitute an investment advice. To read the complete disclaimer click here.


