
This Score-Card analysis of Paycom Software Inc (PAYC) attributes an Overall Score to a company by analyzing several aspects that I consider to be among the most important.
In summary, a company to have an overall score close to 100% must have the following characteristics:
- Report high growth rates in the last 3 years (and in the last quarter) in terms of Revenue, Gross Profit, Operating Income and Net Income. Furthermore, it must operate with high and improving margins in recent years.
- Analysts expect Earnings Per Share (EPS) and revenues to grow in the short term (in the next quarter) and in the medium to long term (in the next 5 years). Moreover, they expect the company to be undervalued at current prices and in the last quarter their EPS expectations must have been beaten with a consequent rise in share prices.
- The stock price of the company must have outperformed the S&P 500 index and in the last 3 months the Hedge Funds and Insiders bought shares in the company.
The overall score ranges from 0% (if the characteristics listed above are all very negative) to +100% and it is unlikely that there will be a company with a +100% score because the requirements for achieving this score are very high, however a score higher than +70% can be considered good.
The purpose of this analysis is purely informative.
Score-Card analysis of Paycom Software Inc (PAYC)
Summary
- Overall Score: +89.4%
- 700 million in Revenue (+ 200% in 3 years)
- 30% growth in Net Income for the last quarter compared to 12 months before
- EPS expected to grow 26% annually for the next 5 years
- Current price slightly overrated according to analysts
- Hedge Funds have increased their positions on PAYC in the last quarter
- x4 performance compared to S&P 500 index since start of 2019

Full description
Paycom Software Inc provides cloud-based human capital management (HCM) software service for small to mid-sized companies in the United States. It provides functionality and data analytics that businesses need to manage the employment life cycle from recruitment to retirement.
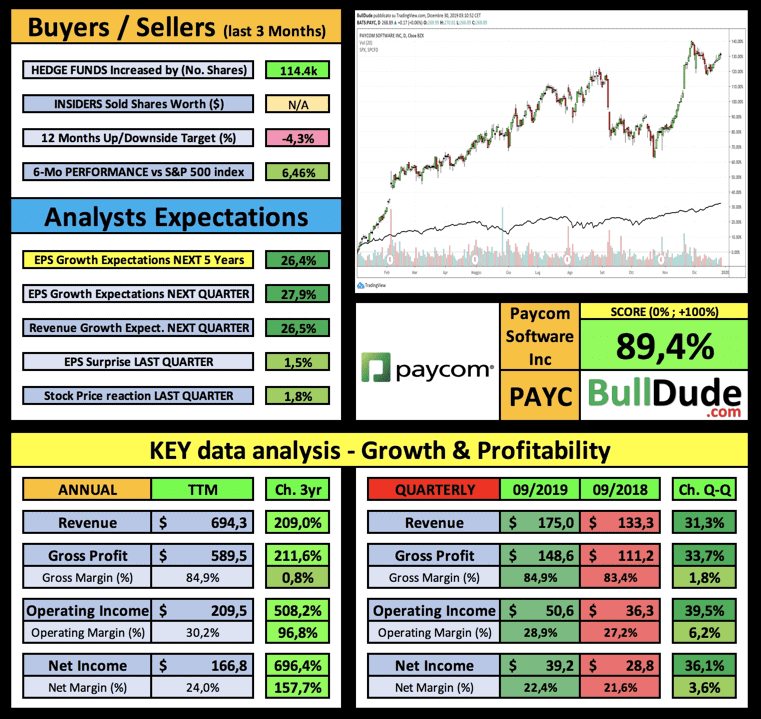
The overall score of PAYC is 89,4% .
In the last 6 months, PAYC has overperformed the S&P500 index by 6,5% and analysts believe the company is overvalued by -4,3% .
In the last quarter, the company reported revenue of 175,01 million, up by 31,3% compared to the same quarter 12 months earlier. Revenue TTM (Trailing-12-Months) are equal to 694,28 million, up by 209,0% in the last 3 years.
PAYC reported an operating income of 50,56 million in the last quarter, an improvement of 39,5% compared to the same quarter 12 months earlier, also reporting an improvement of 6,2% in the operating margin. Considering the sum of the last four quarters (TTM), PAYC reports an operating income of 209,5 Million , a growth of 508,2% compared to three years ago and an improvement of 96,8% in the operating margin.
PAYC reported a net income of 39,15 million in the last quarter, an improvement of 36,1% compared to the same quarter 12 months earlier, also reporting an improvement of 3,6% in the net margin. The TTM net income is 166,84 million , a growth of 696,4% compared to three years ago and the net margin has improved by 157,7% .
In the next quarter, analysts expect growth in EPS (Earnings Per Share) of 27,9% and a growth in revenue of 26,5% . Furthermore, they expect an annual growth of PAYC EPS by 26,4% for the next 5 years.
In the last quarter, PAYC reported better EPS than analysts’ expectations and the stock price reacted by increasing by 1,8% .
Finally, in the last quarter the Hedge Funds have increased their positions by 114.4k shares.
Want to know what other types of analysis are available on BullDude.com?
Click here to find out !!!
This analysis considers numerical data to understand whether a company is good or not based on business growth and whether analysts are positive about it.
If you are interested in identifying a potential entry point, I am waiting for you here to discover the best “buy the dip”, the best companies that follow the “Buy High, Sell Higher” theory or the best chart patterns of the day.
Alternatively, if you are interested in statistical analysis before the publication of the earnings report, an analysis of the quarterly report results released or an analysis of the top 20 companies that release the earnings report during the week, I am waiting for you here.
Do you want to stay updated on all the analysis published?
Follow @BulldudeCSources & additional info
*The comparison with the S&P 500 index (black line) is visible inside the graph.
*Information updated to the last quarterly report available
*Data in Millions of Dollars
*Data from zacks.com, tipranks.com, reuters.com, finance.yahoo.com
*Company information from finance.yahoo.com
DISCLAIMER: The information in this blog post represents my own analysis/opinions and does not contain a recommendation for any particular security or investment. Stocks trading involves substantial risk of loss and is not suitable for every investor. Trade responsibly.
