
Within this article you will find a weekly summary of the 6 BullDude’s Portfolios that are in the testing phase (6 months):
- “Mid / Large – Cap” Portfolio
- “Small – Cap” Portfolio
- “IPOs” Portfolio
- “Tech Stars” Portfolio
- “Growing Business Data” Portfolio
- “Greater Strength” Portfolio
Want to know what BullDude’s Portfolios are?
A very complicated week has ended for stock markets around the world. The main US stock index, the S&P 500, ended the week with a sharp decline (-5.64%), a very similar result for the Nasdaq Composite (-5.51%).
The 6 BullDude’s portfolios ended the week in negative, but all managed to limit losses and therefore outperform their benchmark. The “Tech Stars” portfolio closed the week down by -3.73%, managing to only partially limit the collapse of its benchmark (-5.51% for the Nasdaq Composite).
Despite the difficult week, 5 out of 6 portfolios are performing better than the benchmark. In particular, the “Mid / Large – Cap” portfolio is outperforming the S&P 500 index by 11.52% since the start of the test phase (31 August 2020. Excellent outperformance also of the “IPOs” portfolio (+ 6.61% compared to the benchmark)
Below is the weekly summary for each of the 6 portfolios.
You can find all the daily buying and selling operations in the article “BullDude’s Portfolios: Daily Transactions” which is published in the category “BD-Portfolios”
BullDude’s Portfolios
Weekly Summary
Below for each of the 6 BullDude’s Portfolios you will find the “Current Holdings” screen which contains the positions currently open in the portfolio and a subsequent screen containing the weight that each position occupies in the portfolio. In addition, there is another screen containing the following 4 types of information:
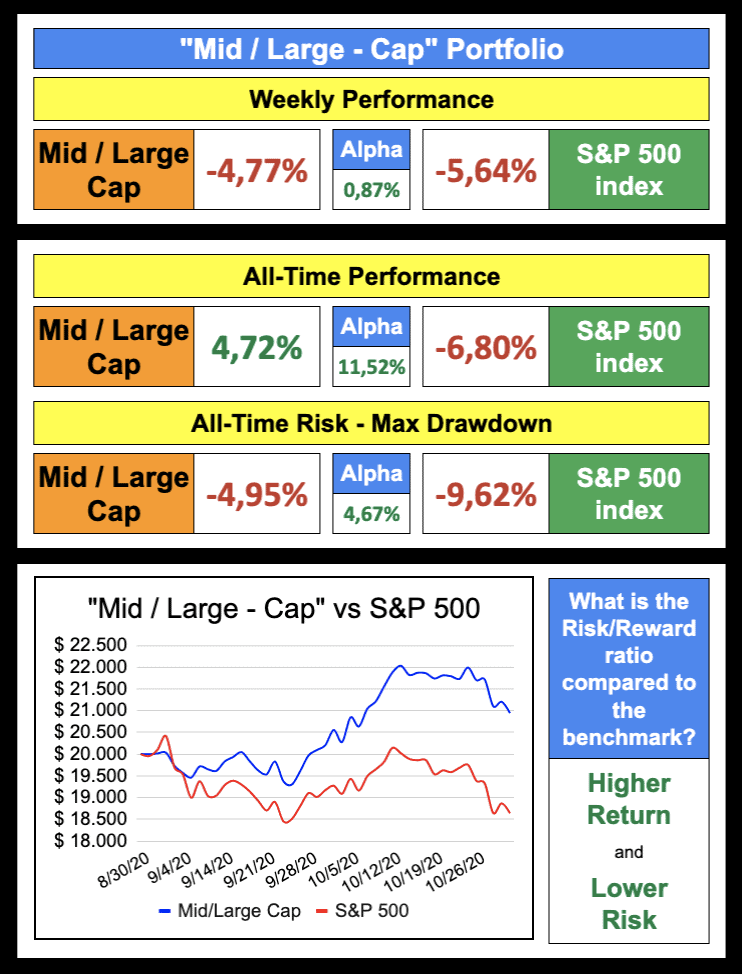
- Weekly Performance
In this section you will find the weekly performance of the portfolio and the index used as a benchmark. In addition, the “Alpha” metric has been added which is calculated as the difference between the performance of the portfolio and that of the benchmark and therefore represents how much the portfolio has performed better / worse than the benchmark. A positive reading indicates that the portfolio outperformed the benchmark.
- All-Time Performance
In this section you will find the same data as the previous section but the reference period is not the week just ended but starting from the beginning of the test phase. In this section, the “Alpha” parameter is fundamental because it shows whether the portfolio has been able to outperform the benchmark since the test began.
- All-Time Risk – Max Drawdown
This section contains one of the main metrics for measuring the risk of a portfolio, the Max Drawdown. This metric is shown for both the portfolio and the benchmark and represents the maximum loss achieved starting from a maximum point to a minimum point. In addition, the “Alpha” parameter is shown which indicates how much the portfolio has risked relative to the benchmark and a positive value indicates that the portfolio has less risk.
- Chart comparison of the portfolio / benchmark and Risk / Reward ratio information
In this section you will find the daily chart of the portfolio and the relative benchmark from the start of the test phase and a box that gives you information on the risk / return ratio of the portfolio. In particular, if the “Alpha” parameters of the 2 sections described above “All-Time Performance” and “All-Time Risk – Max Drawdown” are positive, they indicate that the portfolio is performing better than the benchmark but risking less, ie the optimal situation, and then the indications “Higher Return and Lower Risk” will be shown.
*all-time performance refers to the start of the test phase (31 August 2020). Only the “Tech Stars” portfolio started the testing phase about 1 month later (28 September 2020).
*profit and loss data refer to all open and closed positions
*current holdings of the portfolios directly from Investing.com portfolio tool
“Mid / Large-Cap” Portfolio
Risk Level: Medium
Benchmark: S&P 500 index
The “Mid / Large-Cap” portfolio will only contain companies with a market capitalization of more than $ 5 billion, with no limitations in terms of industry or sector.
Current Holdings
“Membership” is required to read the entire article
Do you have an active “(14-day) Free-Trial” or “Membership”?
Don’t miss an update, join the…
