
This Score-Card analysis of Abbott Laboratories (ABT) attributes an Overall Score to a company by analyzing several aspects that I consider to be among the most important.
In summary, a company to have an overall score close to 100% must have the following characteristics:
- Report high growth rates in the last 3 years (and in the last quarter) in terms of Revenue, Gross Profit, Operating Income and Net Income. Furthermore, it must operate with high and improving margins in recent years.
- Analysts expect Earnings Per Share (EPS) and revenues to grow in the short term (in the next quarter) and in the medium to long term (in the next 5 years). Moreover, they expect the company to be undervalued at current prices and in the last quarter their EPS expectations must have been beaten with a consequent rise in share prices.
- The stock price of the company must have outperformed the S&P 500 index and in the last 3 months the Hedge Funds and Insiders bought shares in the company.
The overall score ranges from 0% (if the characteristics listed above are all very negative) to +100% and it is unlikely that there will be a company with a +100% score because the requirements for achieving this score are very high, however a score higher than +70% can be considered good.
The purpose of this analysis is purely informative.
Score-Card analysis of Abbott Laboratories (ABT)
Summary
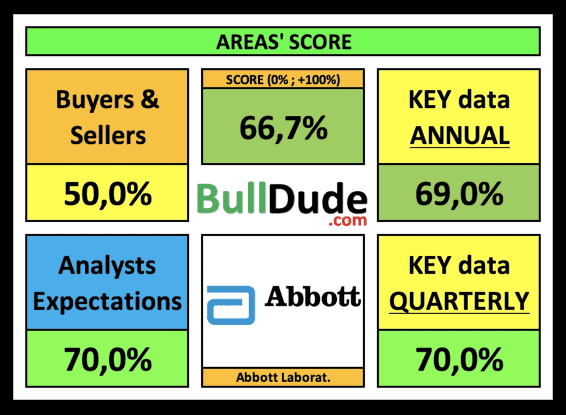
- Overall Score: 66,7%
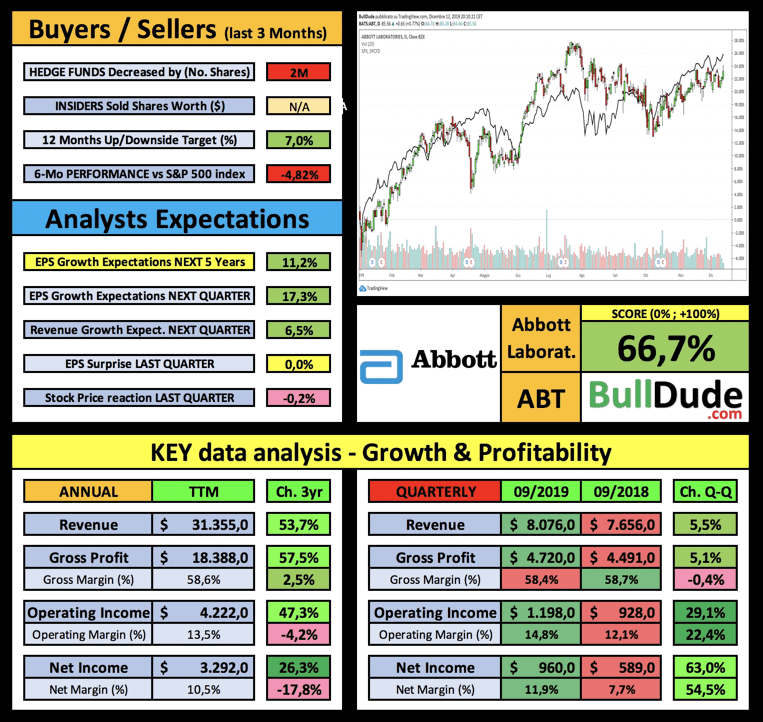
- Good growth over the past 3 years. Revenue up 53.7%. Net Income also increased by 26% but the Net margin worsened by -17.8%.
- Quarterly Net Income up 63% with Revenue up 5.5%.
- Analysts expect an annual EPS growth of 11.2% for the next 5 years and consider the company undervalued by 7% at current prices.
- Hedge funds have reduced their positions by 2 million shares in the last quarter.
Full description
Abbott Laboratories is an American medical devices and health care company with headquarters in Abbott Park, Illinois, United States.
The overall score of ABT is 67% .
In the last 6 months, ABT has underperformed the S&P500 index by -4,8% and analysts believe the company is undervalued by 7,0% .
In the last quarter, the company reported revenue of 8076 million, up by 5,5% compared to the same quarter 12 months earlier. Revenue TTM (Trailing-12-Months) are equal to 31355 million, up by 53,7% in the last 3 years.
ABT reported an operating income of 1198 million in the last quarter, an improvement of 29,1% compared to the same quarter 12 months earlier, also reporting an improvement of 22,4% in the operating margin. Considering the sum of the last four quarters (TTM), ABT reports an operating income of 4222,0 Million , a growth of 47,3% compared to three years ago and a reduction of -4,2% in the operating margin.
ABT reported a net income of 960 million in the last quarter, an improvement of 63,0% compared to the same quarter 12 months earlier, also reporting an improvement of 54,5% in the net margin. The TTM net income is 3292 million , a growth of 26,3% compared to three years ago and has worsened by -17,8% .
In the next quarter, analysts expect growth in EPS (Earnings Per Share) of 17,3% and a growth in revenue of 6,5% . Furthermore, they expect an annual growth of ABT EPS by 11,2% for the next 5 years.
In the last quarter, ABT reported worse EPS than analysts’ expectations and the stock price reacted by decreasing by -0,2% .
Finally, in the last quarter the Hedge Funds have decreased their positions by 2M shares.
Want to know what other types of analysis are available on BullDude.com?
Click here to find out !!!
This analysis considers numerical data to understand whether a company is good or not based on business growth and whether analysts are positive about it.
If you are interested in identifying a potential entry point, I am waiting for you here to discover the best “buy the dip”, the best companies that follow the “Buy High, Sell Higher” theory or the best chart patterns of the day.
Alternatively, if you are interested in statistical analysis before the publication of the earnings report, an analysis of the quarterly report results released or an analysis of the top 20 companies that release the earnings report during the week, I am waiting for you here.
Do you want to stay updated on all the analysis published?
Follow @BulldudeCSources & additional info
*The comparison with the S&P 500 index (black line) is visible inside the graph.
*Information updated to the last quarterly report available
*Data in Millions of Dollars
*Data from zacks.com, tipranks.com, reuters.com, finance.yahoo.com
*Company information from wikipedia.com
DISCLAIMER: The information in this blog post represents my own analysis/opinions and does not contain a recommendation for any particular security or investment. Stocks trading involves substantial risk of loss and is not suitable for every investor. Trade responsibly.
