
This analysis attributes an Overall Score to a company by analyzing several aspects that I consider to be among the most important.
In summary, a company to have an overall score close to 100% must have the following characteristics:
- Report high growth rates in the last 3 years (and in the last quarter) in terms of Revenue, Gross Profit, Operating Income and Net Income. Furthermore, it must operate with high and improving margins in recent years.
- Analysts expect Earnings Per Share (EPS) and revenues to grow in the short term (in the next quarter) and in the medium to long term (in the next 5 years). Moreover, they expect the company to be undervalued at current prices and in the last quarter their EPS expectations must have been beaten with a consequent rise in share prices.
- The stock price of the company must have outperformed the S&P 500 index and in the last 3 months the Hedge Funds and Insiders bought shares in the company.
The overall score ranges from -100% (if the characteristics listed above are all very negative) to +100% and it is unlikely that there will be a company with a +100% score because the requirements for achieving this score are very high, however a score higher than +40% can be considered good.
This analysis alone is not enough to decide whether or not to invest in a company because it does not provide indications on the timing of entry, but it is a good starting point.
Don’t forget to LIKE and ACTIVATE notifications on Facebook or Twitter so you DON’T MISS any analysis. At the bottom of this article you will find the steps to activate them.
Apple Inc. (AAPL)
Summary
- Overall Score: -3.7%
- Analysts are pessimistic in the short term, but optimistic in the long term
- Distance from the October 2018 historical price: -6.74%
- YTD performance: +38.47%

Don’t forget to LIKE and ACTIVATE notifications on Facebook or Twitter so you DON’T MISS any analysis. At the bottom of this article you will find the steps to activate them.
Full description
The overall score of AAPL is -3.7% .
In the last 6 months, AAPL has overperformed the S&P500 index by 11,0% and analysts believe the company is undervalued by 2,4% .
In the last quarter, the company reported revenues of 53809 million, up by 1,0% compared to the same quarter 12 months earlier. Revenue TTM (Trailing-12-Months) are equal to 259034 million, up by 10,8% in the last 3 years.
AAPL reported an operating income of 11544 million in the last quarter, worsening by -8,5% compared to the same quarter 12 months earlier, also reporting a reduction by -9,4% in the operating margin. Considering the sum of the last four quarters (TTM), AAPL reports an operating income of 64423,0 Million a decrease of -9,6% compared to three years ago and a reduction of -18,4% in the operating margin.
AAPL reported a net income of 10044 million in the last quarter, worsening by -12,8% compared to the same quarter 12 months earlier, also reporting a reduction by -13,7% in the net margin. The TTM net income is 54595 million , a growth of 2,2% compared to three years ago and has worsened by -7,7% .
In the next quarter, analysts expect decrease in EPS (Earnings Per Share) of -3,1% and a decrease in revenue of -0,2% . Furthermore, they expect an annual growth of AAPL EPS by 9,7% for the next 5 years.
In the last quarter, AAPL reported better EPS than analysts’ expectations and the stock price reacted by increasing by 2,0% .
Finally, in the last 3 months the Hedge Funds have decreased their positions by 916.2k shares. The Insiders have sold shares worth $7.27M .
Sources & additional info
*Data updated to the last quarterly report available
*Data in Millions of Dollars
*Data from zacks.com, tipranks.com, reuters.com, finance.yahoo.com
This analysis gives you a general idea of whether a company is good or not, but you may also be interested in finding potential entry points, so I am waiting for you here to know about the best chart patterns of today.
ACTIVATION OF NOTIFICATIONS
You can stay updated on my analysis in 2 ways:
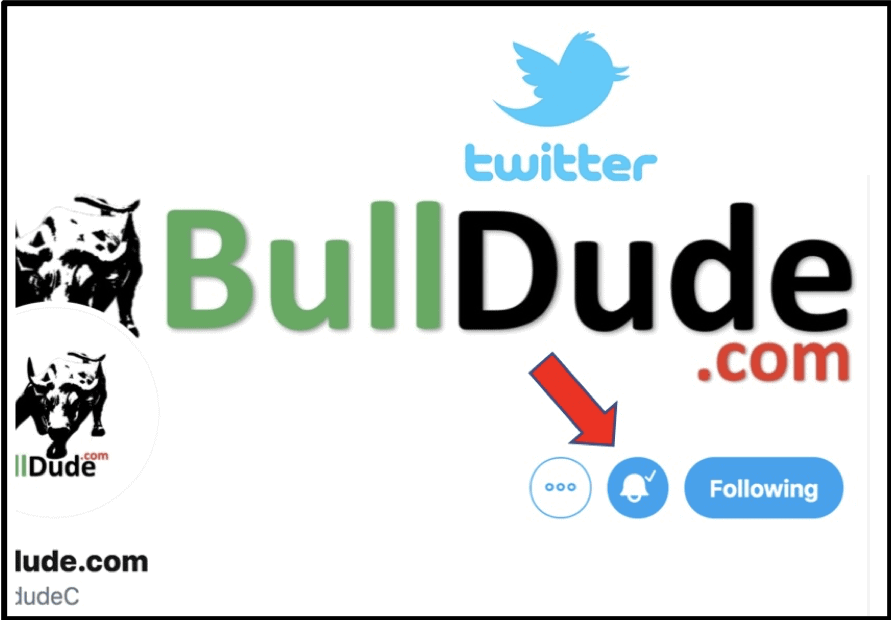
Steps for Twitter
- like my Twitter page BullDude.com
- click on the bell (to the left of the Follow button)
- NB: Make sure you have active PUSH notifications in the settings
- NB: if you do this procedure from the Twitter app you must also select “All posts”
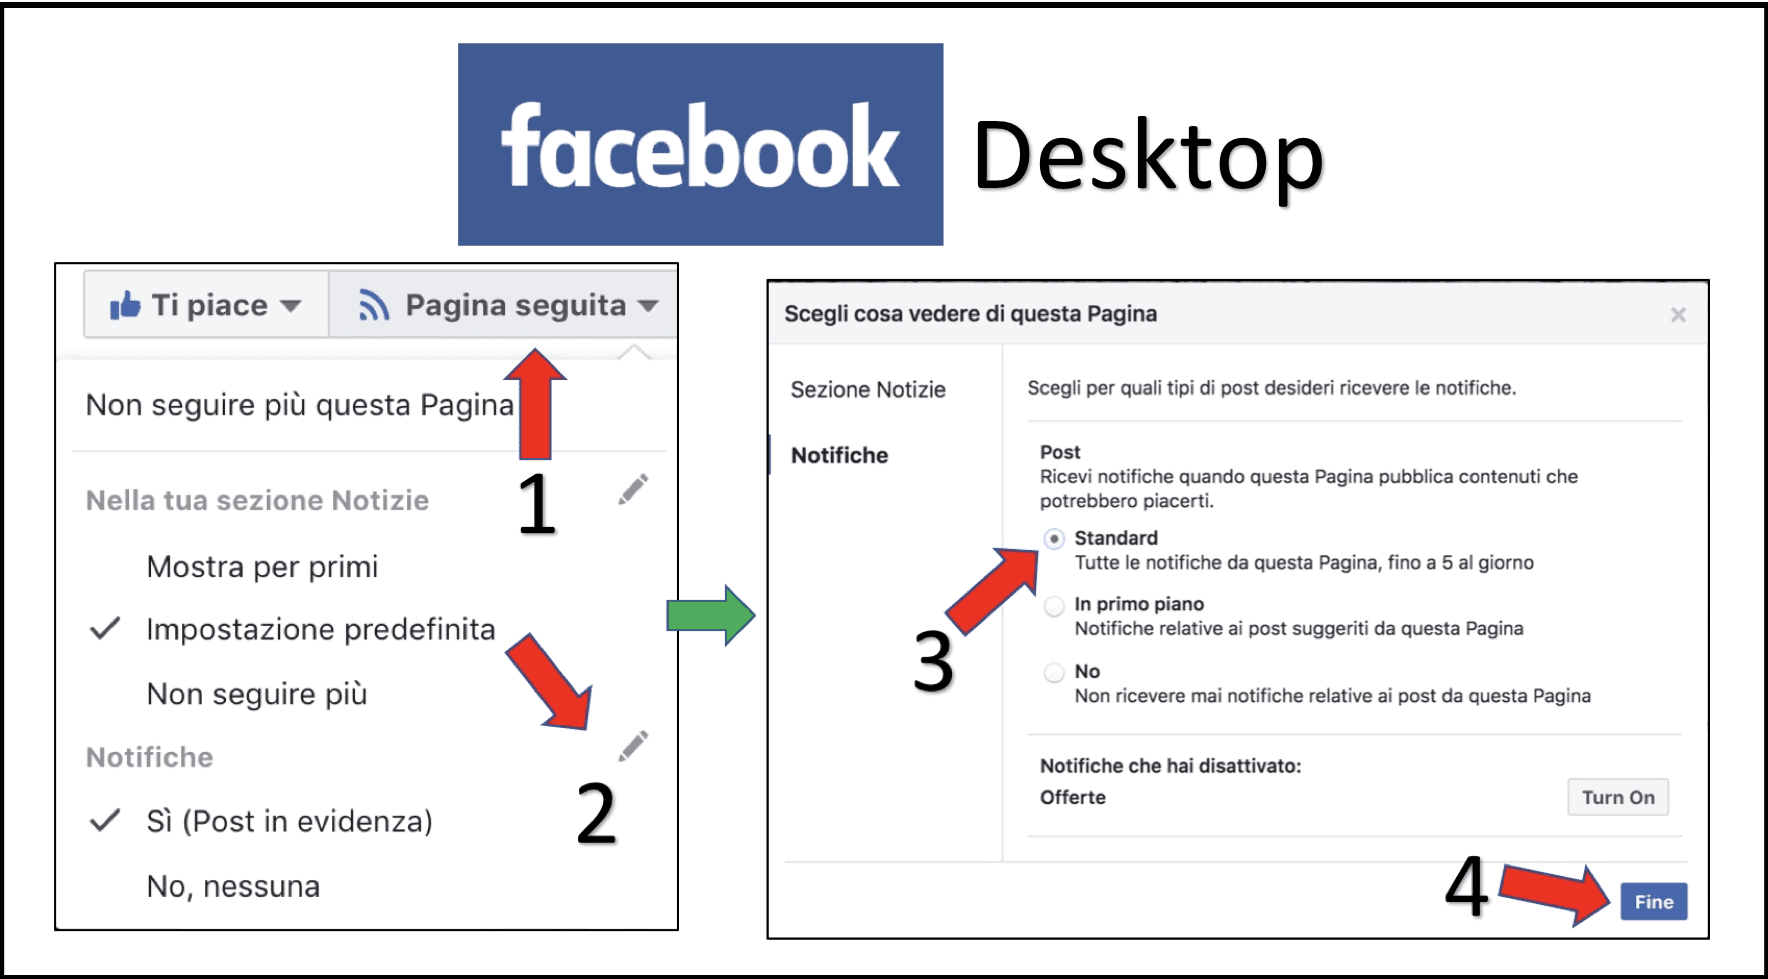
Steps for Facebook Desktop
- like my page BullDude.com
- pass the mouse on the “Follow” button (or “Segui” in Italian) – (point 1 of the image)
- click on the pencil near to the word “Notifications” (or “Notifiche” in Italian – (point 2 of the image)
- in the window that opens click on “Standard” – (point 3 of the image)
- click to confirm and close the window – (point 4 of the image)
Steps for Facebook App
- like my page at BullDude.com
- click on the 3 dots (…) under the thumb of “like” – (point 1 of the image)
- click on “Following” – (point 2 of the image)
- click on “Edit Notifications Settings” – (point 3 of the image)
- select “Standard” – (point 4 of the image)

DISCLAIMER: The information in this blog post represents my own analysis/opinions and does not contain a recommendation for any particular security or investment.
