
Inside this article you find companies with a potential start/continuation signal of a mid-term positive trend according to one of the most used trading tools, simple moving average. In particular, the 50-day Moving Average Breakout Chart Patterns. In addition, the companies shown here have a particular chart conformation that increases the probability of the positive trend continuing.
Moving averages are one of the most used tools in trading because they allow you to identify the presence of a positive or negative trend based on the position of the stock price with respect to it. One of the most important moving averages is the one calculated as the average price of the last 50 trading sessions and if the price is above it (or below) it indicates the presence of a mid-term positive (or negative) trend.
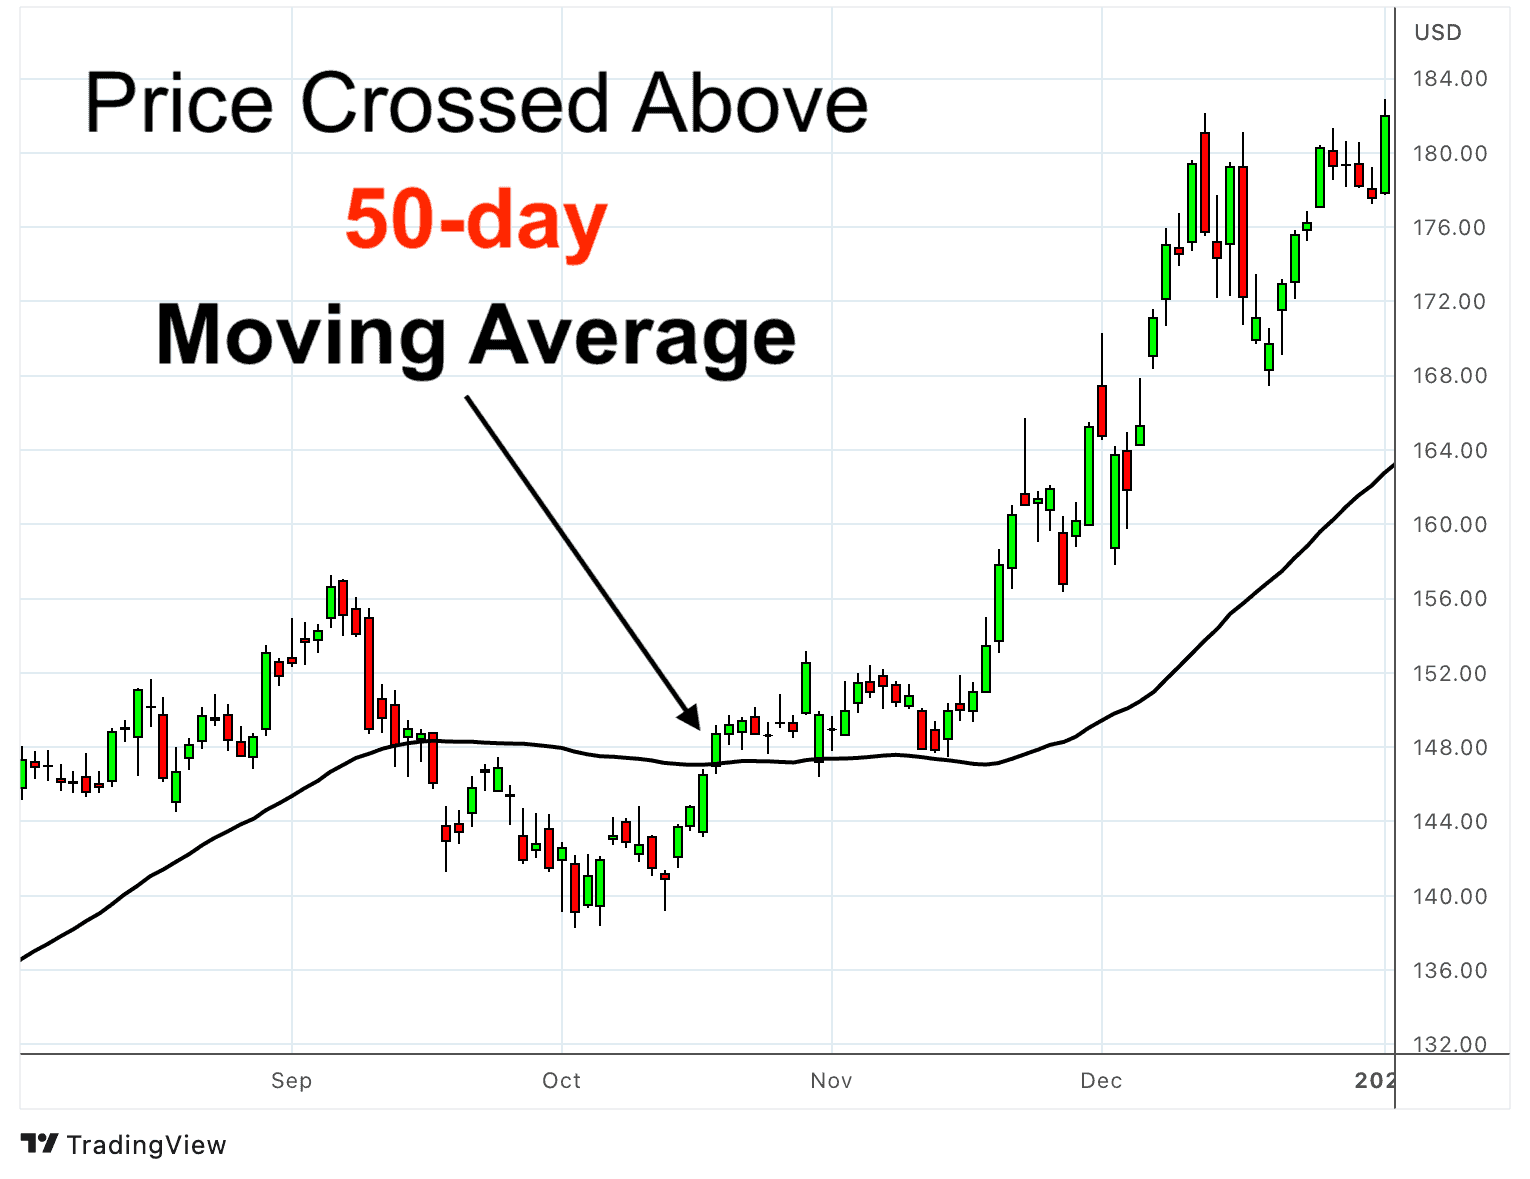
So knowing which companies have just moved from a negative to a positive mid-term trend (so the price has crossed above the 50-day moving average) is very useful information.
Within the BullDude.com Membership you will find many articles published constantly called “Moving Average Breakout” containing the best companies that have just entered a positive mid-term trend, ie the price has crossed above the 50-day moving average.
Today’s 50-day Moving Average Breakout
Company 1:
Are you a member? Login


Company 2:


Company 3:


Exclusive Content
for Members
Are you a member? Login
If you are NOT a member keep reading!
EVERYTHING
YOU NEED
FOR YOUR TRADING
Meet your all-in-one membership.
SCREENER
Find out every day which Stocks and Crypto show the best chart patterns and trading signals.
BACKTEST
Find out which stocks have shown the best results after a certain chart pattern or trading signal has appeared.
CHART PATTERNS
Discover the stocks showing the resistance, trendline and potential breakout chart patterns
TREND ANALYSIS
Discover the direction and strength of the trend of the 150 best stocks and the 50 best crypto.
STOCK ANALYSIS
Discover the most interesting stocks based on the key business data such as revenue and net income.
EARNINGS REPORTS
Discover the analysis on the most anticipated stocks that are about to release the earnings reports.
WHAT WE OFFER
Satisfied or Refunded
Not satisfied? No problem. Just let us know within 14 days and you will get a full refund without having to give us an explanation.
Secure Payments
Choose from the 2 world leaders in digital payments that guarantee 100% security. PayPal and Stripe.
Up to 16% off
Take advantage of the 16% discount on 1-Year Membership, equivalent to a cost of $ 3.80 per week while saving $40 in 1 year.
What are you waiting for?
Access hundreds of exclusive content with the BullDude.com Membership
You May Also Like…


To discover the other Chart Patterns published on BullDude.com
Don’t want to miss BullDude.com exclusive content?
Join the Telegram Channel for free
Do you need help? contact us:
Mail: bulldude.info@gmail.com
Everything You Need For Your Trading
In BullDude.com Membership you will find exclusive content in one place:
👉 Screener and Backtest
👉 Chart Patterns
👉 Trend Analysis
👉 Key Business Data
👉 Earnings Reports
Data provided by Financial Modeling Prep
The content of this article is for informational purposes only and in no case constitute an investment advice. To read the complete disclaimer click here.
